Here I will present some tests and analyze them to find out some COVID-19's behaviours. Again, please note the simulation is a simple model where the outputs can be different from the ones in the real world.  |
Image created by Underway Studio. Submitted for United Nations Global Call Out To Creatives
|
Tablets| Computers, Tablets & Components
|Desktops|
Laptop Accessories|
Laptops
Computers, Tablets & Components
|Desktops|
Laptop Accessories|
Laptops
I suggest you use the simulation yourself and tweak the configurations file to better understand the simulation's behaviour. By using the config.yaml file to change some of the simulation parameters we can test different case scenarios to better understand the spread of the virus.
Sometimes we mislead ourselves by taking someone's statement as the absolute truth and that leads us to some mistakes. And you know, against COVID-19 any mistake counts and can get you and your loved ones in real danger. So I will show some tests results and analyse them in this post.
Disclaimer
This project aims to simulate the human being and COVID-19 behaviours, however, the real behaviours can be very different from the conceptual model I defined. The simulation's results are based on simple math calculations and probabilities, where we have a big margin for errors.
To assess the influence of the agent's behavior on the numbers of new and total of infected agents, I ran the following tests:
- Social distance effect - In this test, I used the static begging approach.
- Wearing a mask effect - In this test, I used the static begging approach to specify the number of agents wearing a mask in each run.
- Quarantine effect
- When quarantine starts - In this test, I used the static begging approach to specify the number of days until agents starting to do quarantine.
- Percentage of infected agents detected in each day and taken to quarantine - In this test, I used the static begging approach to specify the percentage of agents detect and taken to quarantine in each day.
- Environment's size effect - In this test, I used the static begging approach.
- Vaccine effect - In this test, I used the static begging approach.
For each test, I run the simulation 10 times. Then I call the simulation's mode that shows the charts with the average of the values on each day from all the n simulations I ran. As the simulations are based on random moves and probabilities, each time we run the simulation the output is slightly different. So I chose to use the average of the values to have close reality results to analyse.
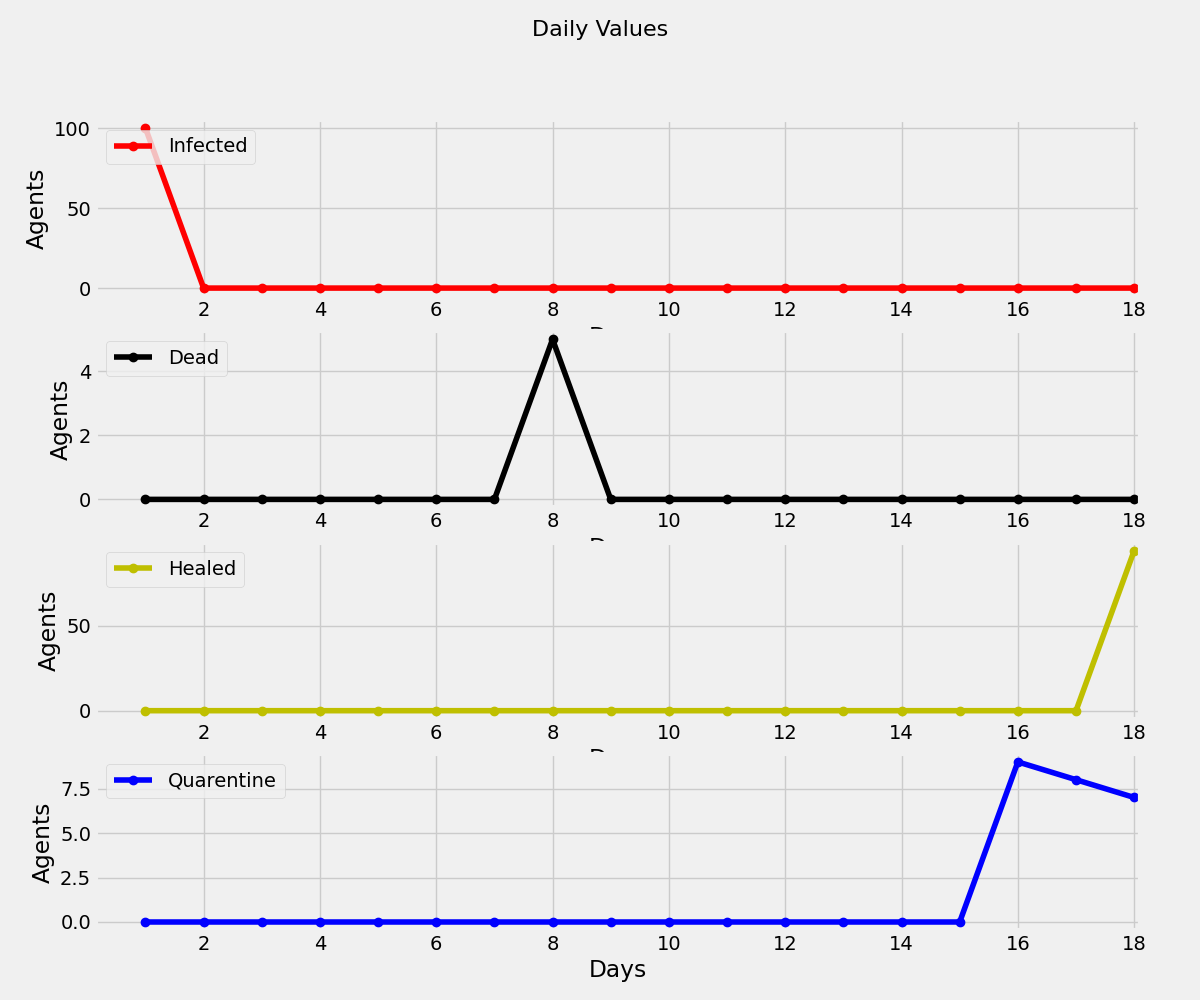
The charts in this post will be of two types and will be always shown in the same order. The first one appearing for each test case is the chart with the daily values for healthy, infected, dead, and quarantine agents. The second one shows the cumulative values for the same metrics.
I want to point out the fact that by using the average of the n=10 simulations we find some drops (n-1) in the chart values. This means that in each drop one simulation stopped. As you might already know, the different simulation runs end in different days according to the number of infected agents. The simulation stops when there are no more infected agents. Therefore, when a simulation takes more days to finish, I set to 0 the values for each metric in each day the other simulations do not have. For instance, if a simulation A ends in day 600 and a simulation B at day 200, from the day 200 until 600 I will use 0 as the value for all metrics in B simulation when doing the average. So, you can look to the cumulative chart and see when a simulation stopped, as it has a drop in the chart values.
 |
| Probability of being infected when in contact with an infected agent. (Same values used in all tests) |
 |
| Static Beginning Configuration |
1. Social Distance Effect
 |
| config.yaml file important used configurations |
The following tests use the static beginning mode. The changed values are the SOCIAL_ DISTANCE and SOCIAL_ DISTANCE_ STEP ones. The SOCIAL_DISTANCE constant defines the minimum distance between two agents when the simulation generates the initial position of each agent. Concerning the SOCIAL_DISTANCE_STEP, it defines the minimum distance between two agents when they move.
Test 1
Configurations:
- SOCIAL_DISTANCE: 0
- SOCIAL_DISTANCE_STEP: 0
Results:
Test 2
Configurations:
- SOCIAL_DISTANCE: 0
- SOCIAL_DISTANCE_STEP: 1
Results:
Test 3
Configurations:
- SOCIAL_DISTANCE: 0
- SOCIAL_DISTANCE_STEP: 2
Results:
Test 4
Configurations:
- SOCIAL_DISTANCE: 1
- SOCIAL_DISTANCE_STEP: 2
Results:
Test 5
Configurations:
- SOCIAL_DISTANCE: 2
- SOCIAL_DISTANCE_STEP: 2
Results:
The resulting charts show us an already known behaviour. If we do not care about the social distance, as in test 1, we have a lot more infected agents compared to the test cases where we used social distance. In fact, the virus stops its spread in day 1 when we respect the social distance in a restrict way.
2. Wearing a Mask Effect
The following tests use the static beginning mode. The changed value is AGENTS_ WEARING_ MASK. This constant defines the number of agents wearing a mask in the simulation. Then the masks are "randomly distributed" among the agents.
 |
| config.yaml file important used configurations |
- AGENTS_WEARING_MASK: 1000
Results:
- AGENTS_WEARING_MASK: 1500
Results:
- AGENTS_WEARING_MASK: 2000
Results:
As we move forward through the test cases, we are increasing the number of agents wearing a mask. By evaluating the charts, we can see the more agents wearing a mask, the fewer cases of infections we have, and the faster the virus is defeated (number of days).
3. Quarantine
3.1 When quarantine starts
The following tests use the static beginning mode. The changed value is QUARANTINE_DAYS. This constant defines the number of days until the health authorities starting to send agents to the quarantine zone.
 |
| config.yaml file important used configurations |
Test 1
Configurations:
Results:

Test 2
Test 3
Test 4
Test 5
Configurations:
Results:
As we can see in the charts, as we increase the number of days to wait until agents starting to go into a quarantine zone, the number of infections and the number of days with infected agents also increases.
3.2 Percentage of infected agents detected in each day and taken to quarantine
The following tests use the static beginning mode. The changed value is QUARANTINE_PERCENTAGE. This constant defines the percentage of infected agents that are detected and sent to quarantine each day.
 |
| config.yaml file important used configurations |
- QUARANTINE_PERCENTAGE: 0.1
Results:
- QUARANTINE_PERCENTAGE: 0.3
Results:
- QUARANTINE_PERCENTAGE: 0.5 ja esta em cima ???
- QUARANTINE_PERCENTAGE: 0.8
Results:
Evaluating the charts, we can see the higher the number of infected agents detected each day, the fewer cases of infections we have, and the faster the virus is defeated (number of days).
4. Size and space where agents can move
4.1 Number of agents in the same space
The following tests use the static beginning mode. The changed values are the TOTAL_NUMBER_OF_AGENTS and the static params (changed taking into account the proportion of agents for each type).
- TOTAL_NUMBER_OF_AGENTS: 3000
- SOCIAL_DISTANCE: 0
- SOCIAL_DISTANCE_STEP: 0
- AGENTS_WEARING_MASK: 0
 |
| New static parameters for 3000 agents |
Results:
Test 2
- TOTAL_NUMBER_OF_AGENTS: 1000
- SOCIAL_DISTANCE: 0
- SOCIAL_DISTANCE_STEP: 0
- AGENTS_WEARING_MASK: 0
 |
| New static parameters for 1000 agents |
Results:

Evaluating the charts, we can see the higher the number of agents in the same area, the greater the percentage of infected agents. In test 1, we have an average of 2201 new infected agents from a total of 3000 agents, resulting in about 73% of new infections. In test 2, we have an average of 197 new infected agents from a total of 1000 agents, resulting in about 20% of new infections.
5 Vaccine influence
To simulate the vaccine influence, I set up the simulation configurations based on some assumptions. I chose to use a percentage of 90% of the vaccine effectiveness, there are more optimistic values but I guess 90% is a high value. So, I am defining the number of immune agents as 90% of the vaccinated agents. My main test is to check if we vaccinate all healthy agents we stop having new infection cases.
The following tests use the static beginning mode. The changed value is TOTAL_ NUMBER_ OF_ AGENTS.
Test 1
Configurations:
Assuming no social distance and no care about masks. Moreover, I am assuming we are vaccinating all healthy people that never was infected until now.
- TOTAL_NUMBER_OF_AGENTS: 3000
- SIZE: 300
 |
| Static configuration |
- IMMUNE_IMR_NBR: (TOTAL_NUMBER_OF_AGENTS - (SICK_NBR + ASYMP_NBR)) * 0.9 = 2565
- To the total of agents, we remove the infected ones at the beginning of the simulation. Therefore, we have now the healthy ones. From them, we set 90% of them as immunes, by using their immune system response instance variable.
Results:
Test 2
Configurations:
- TOTAL_NUMBER_OF_AGENTS: 1000
- SIZE: 300
 |
| Static configuration |
Results:
Test 3
In this test, I increased the number of people in the same area, to simulate, for instance, a sector in a football stadium. After getting the vaccine, is it safe to go out to crowded places? Or should we wait until the vaccine's immunity effect starts taking down the virus?
Configurations:
- TOTAL_NUMBER_OF_AGENTS: 6000
- SIZE: 300
 |
| Static configuration |
Results:
Evaluating the chart results, we can see that even vaccinating everyone we will still have newly infected agents in the first month. Please note, in this test we are assuming that everyone is already vaccinated (healthy people without previous contact with the virus), and in the reality, vaccinating is a slow process that takes months.
A key point in these tests is the fact if we stop being alert as soon as we start to vaccinate the population, we will still get a high number of newly infected people. Look to test 3 where I am testing the influence of not caring about social distance, mask, and go to crowdy areas. The result is 6.3% of new infections and 1.1% of dead agents. Comparing to test 1 where we have 2.6% and 0.5% of infected and dead agents, and to test 2 where we have 0.6% and 0% of infected and dead agents respectively, we can state that even with the vaccine the virus will persist if we do not keep restricting our actions.
Conclusions
For readability, I had split the post about the simulation into 3 so you can find the key points you want to know.
The conclusions can be found here.
Code
You can find the simulation's code at
Github.


Comments
Post a Comment